Categories
Sports

Concordia Stingers hockey by the numbers

A mid-year look at how the men’s and women’s teams are doing from a statistical standpoint

With Concordia’s hockey teams set to take some time off for the winter break, it’s a perfect chance to take a statistical peak into how the school’s two teams have been performing this year.

The men’s team posted a 9-4-0 record through 13 games this season, while the women’s team has had a rougher time so far, playing to a 2-5-0 record in seven games. All statistics are up to date as of Nov. 24.

Men’s Team

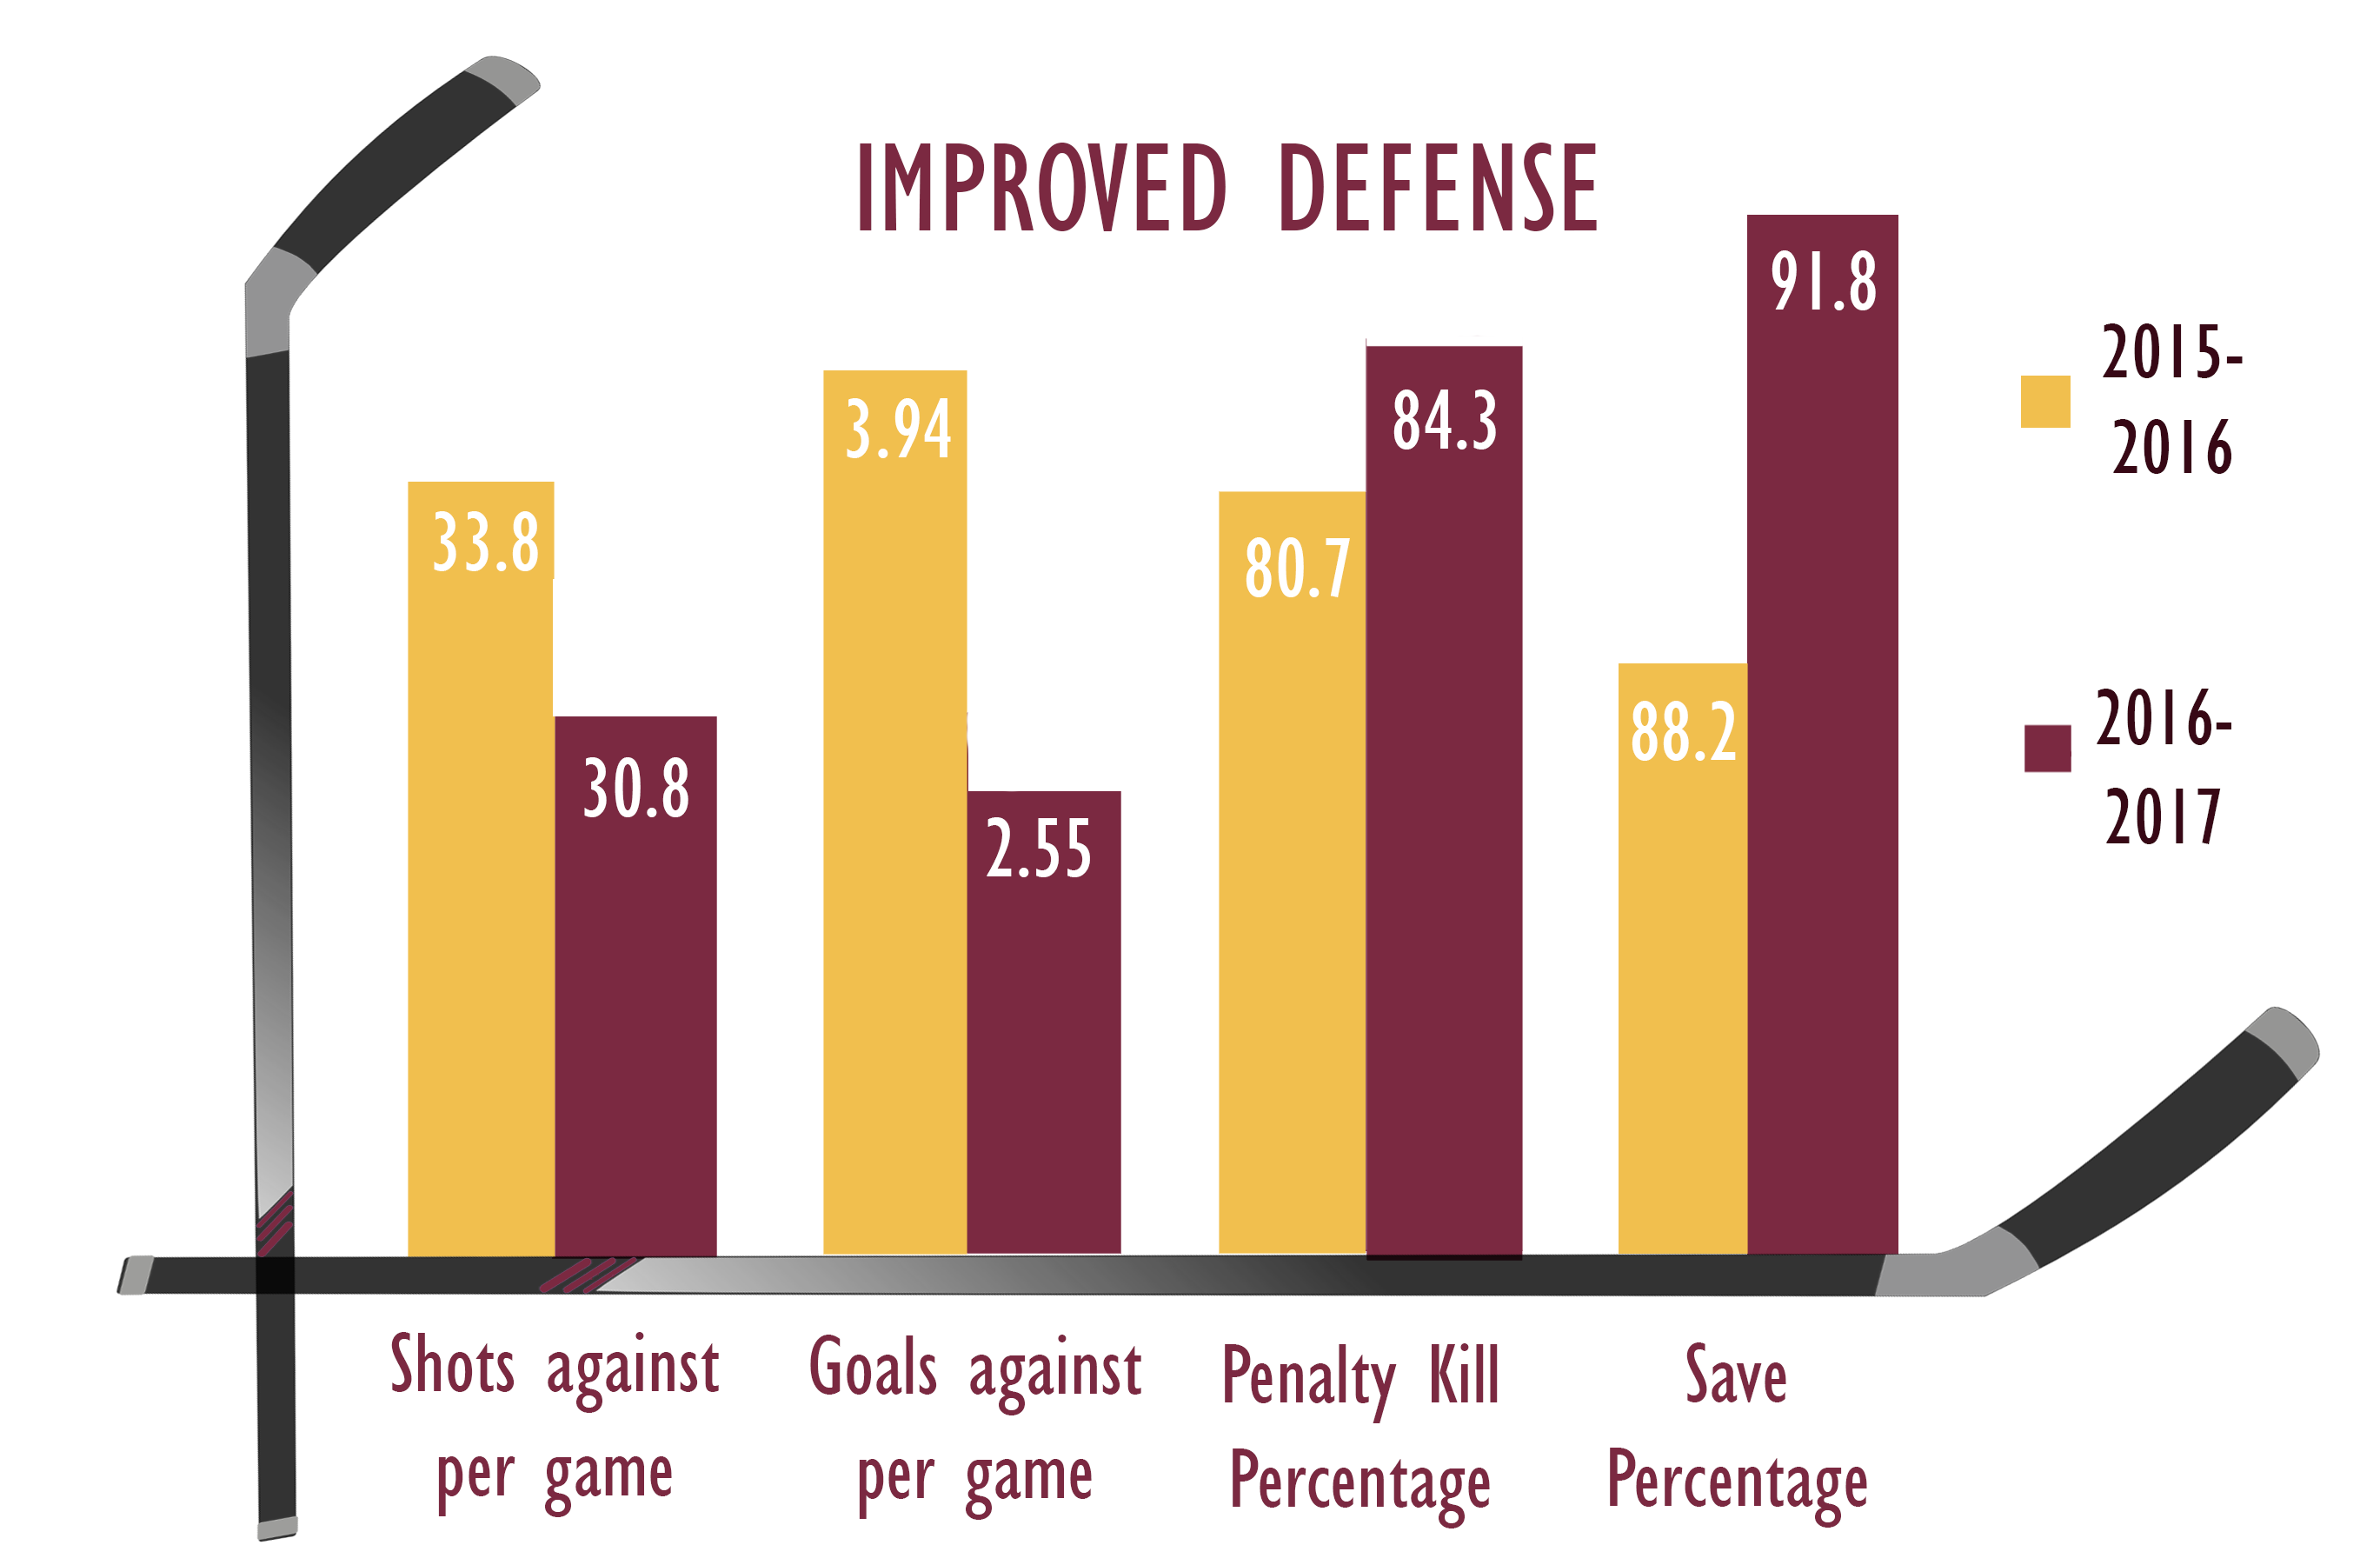
Last year, the Stingers had no trouble putting the puck in the net. What the team lacked was consistent defense—the 2015-16 squad allowed almost four goals-against per game.

However, the Stingers have tightened up their game, improving in virtually every defensive category. In just 13 games, the Stingers have almost matched their win total from last season, thanks in part to solid team defence.

The Stingers were busy this summer, recruiting three high profile players to their roster, adding to their depth at the forward positions and addressing their defensive weaknesses.

Forward Philippe Sanche played four years in the Quebec Major Junior Hockey League (QMJHL), scoring 200 points in 210 games before joining the Stingers, according to hockeydb.com. He was voted the hardest working player in the league in 2015 and has already had an offensive impact with the team.

Forward Anthony Deluca brings even more experience, having played professional hockey last year in the ECHL. Not only does Deluca lead the Stingers in scoring, but he ranks second in all of U Sports in goal scoring.

Still, it’s goaltender Philippe Cadorette who has had the greatest impact on the team’s success. Cadorette, has 209 games of experience in the QMJHL and has been able to provide the Stingers with the type of consistent goaltending the team lacked last year. He has stopped 322 of 352 shots this year.


At first glance, it would be safe to assume that the Stingers women’s hockey team has been struggling this season. However, a deeper look into their play reveals that there is room for optimism.

Shots-For-Percentage (SF%) is a statistic that measures how much a team controls the flow of play. The Stingers may have trouble elsewhere, but with coach Julie Chu at the helm, they have been outshooting their opponents more effectively than they have in years.

Where things have gone wrong for the women’s team is in net. The Stingers are dead last in save percentage in the entire country, and not by a small margin.

Starting goaltender Katherine Purchase and backup Briar Bache have combined for an 84.6 per cent save percentage this season, meaning the team has allowed 3.28 goals-against per game. For reference, the average save percentage in U Sports this year has been 91.2 per cent.

Despite her struggles, Purchase is poised to bounce back from her weak start. This season’s results included, she’s posted a 91.6 per cent save percentage in her three years in U Sports. She was also named Réseau du sport étudiant du Québec (RSEQ) rookie of the year in 2014-15.

If Purchase is able to return to form and the team maintains their strong defensive play,  the Stingers could become one of the toughest teams to score against in the league.

Categories
Sports

Advanced hockey analytics for dummies

Examining the importance of “Corsi” when evaluating NHL players and their performance

Many are quick to claim that the use of statistical analysis in hockey is a waste of time. Some fans say the game is too fluid, too quick, too random—how could you possibly isolate one player’s impact? This isn’t baseball!

Please do not confuse the difficult with the impossible.

Of the major sports played in North America, hockey is among the hardest to capture on a spreadsheet. It doesn’t have the structure of baseball or football, nor the slow pace of soccer, nor basketball’s focus on star players. It’s a fast, chaotic game where every puck bounce can flip the game on its head in an instant.

But where’s the fun in not trying?

Entire books could be written on the topic (many have been, in fact). Here, we’ll stick to the most basic of basics, the holy grail of hockey analytics: the infamous “Corsi” statistic.

Teams that have the puck on their sticks for most of the game tend to win more than they lose. It’s an intuitive idea, and one that lies at the very heart of hockey analytics. In the past, each team’s possession of the puck was measured by a stopwatch. Today, Corsi events, which are any kind of shot attempts (missed shots, blocked shots, and shots on goal), are tallied in order to measure the same thing. This is because, in order to shoot the puck, a team has to be in possession of it first. Think plus/minus (the stat that measures if you score more goals than you let in goals), but for shot attempts instead. The result is then converted to a ratio or percentage. A team that has a “Corsi For %” of 60 per cent, for instance, makes three shot attempts for every two they allow.

These ratios are also calculated for individual players, by counting every shot attempt they were on the ice for. With this information, analysts can evaluate one player’s impact on their teammates by comparing possession rates with that player on and off the ice. If their teammates  achieve a worse shot differential without that player than with him, then that player is most likely a positive influence on the team.

Why does this matter? First, according to The Hockey Writers, possession metrics do a great job at predicting how teams will do in the standings. Also, before analytics, the only statistic that measured a player’s defensive impact was plus/minus, which doesn’t go as in-depth.

Examining a player’s impact on shot rates, both offensively and defensively, offers a more complete perspective. Over time, the better players on the ice will help their team outshoot their opposition, while the lesser players will hinder their team’s shot differentials. If a player is more effective at preventing shots in their zone, winning puck battles, passing, carrying the puck up the ice, etc., then those skills will be reflected in their Corsi numbers.

As far as getting your toes wet and researching some basic possession numbers for various NHL teams, www.stats.hockeyanalysis.com would be a good place to start. There is also corsica.hockey, a more complex and comprehensive site, which allows for more customization when comparing statistics. Ironically, NHL.com, which recently went to great lengths to expand its statistics department, is to be avoided; it’s unintuitive, poorly laid out, and the quality control for its data is dubious at best.

Exit mobile version